Scrolling banner with event information. Learn More

Scrolling banner with more event information. Learn More

Scrolling banner with even more event information. Learn More

Visualize Learning Data with rapidInform

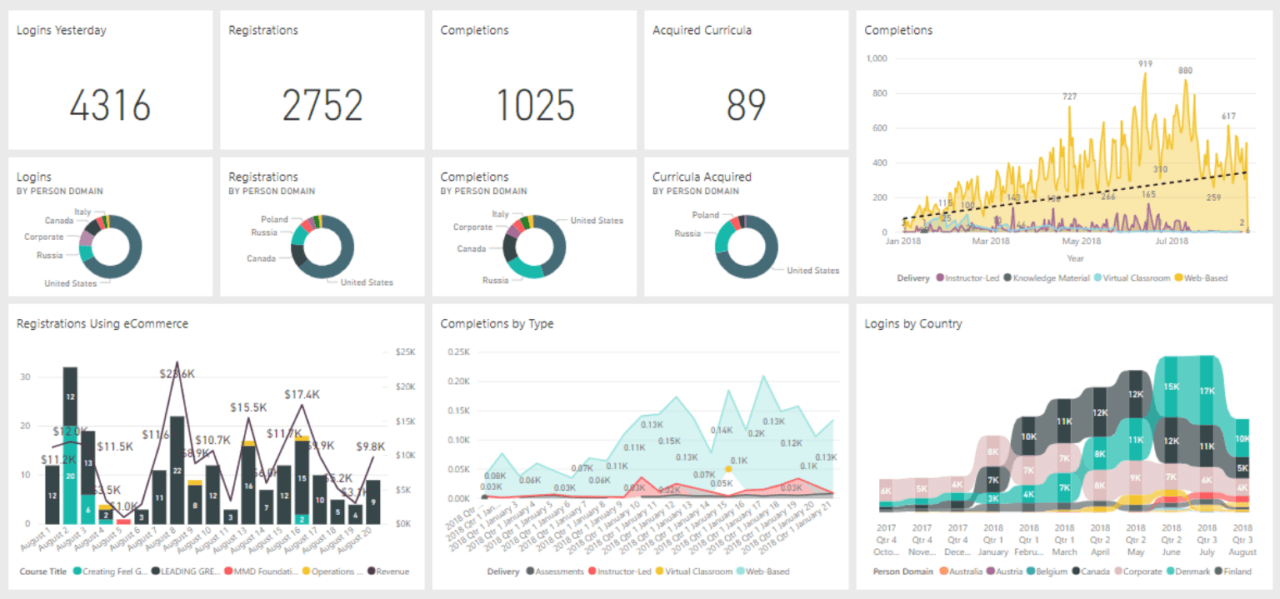
Bring your learning data to life with stunning dashboards and the ability to slice millions of records instantly.

Some of Our Offerings

A blue outlined magnifying glass inspecting a small rectangular document icon, beside three vertical bar-like lines, on a white background.

Relevant Dashboards

Transform and simplify the ways you visualize, analyze, and act upon your learning data.

A stylized globe with connecting nodes and a small sun emblem is cradled by two open hands, rendered in cyan line art on a dark background.

Training and Support

Services in the process and best practices for automating the data transfer from your LMS to Power BI.

Three blue line-art browser windows overlap; one displays a smartphone icon, others show UI blocks and a menu, arranged to suggest interconnected web interfaces on a plain white background.

Advanced Concepts

Access near unlimited ways of expressing data and transform it into actionable reports that help drive data-based decisions.

A dashboard displays learning analytics: summary tiles, donut charts, bar and line charts, and stacked-area plots visualizing logins, registrations, completions, curricula, revenue, and country activity.